Single-node performance
The hosts/LB/end-points are run as docker pods inside a single server/node. The topology is as follows :
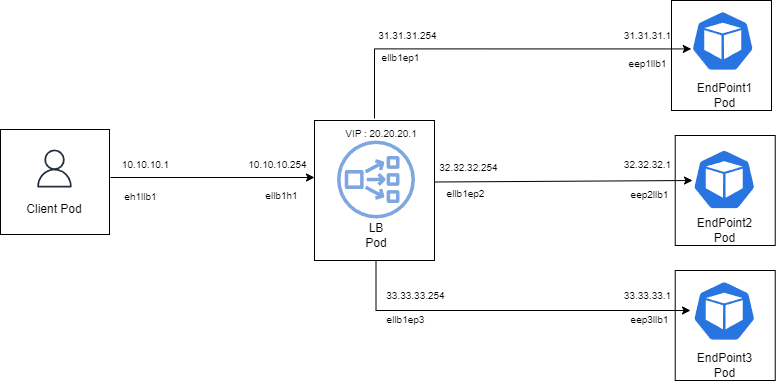
The following command can be used to configure lb for the given topology:
# loxicmd create lb 20.20.20.1 --tcp=2020:5001 --endpoints=31.31.31.1:1,32.32.32.1:1,33.33.33.1:1
The testing is done with full stateful connection tracking enabled (non dsr mode). To create the above topology for testing loxilb, users can follow this guide. A go webserver with an empty response is used for benchmark purposes. The code is as following :
package main

import (
        "log"
        "net/http"
)

func main() {
        http.HandleFunc("/", func(w http.ResponseWriter, r *http.Request) {

        })
        if err := http.ListenAndServe(":5001", nil); err != nil {
                log.Fatal("ListenAndServe: ", err)
        }
}
The above code runs in each of the load-balancer end-points as following :
go run ./webserver.go
wrk based HTTP benchmarking is one of the tools used in this test. This tool is run with the following parameters:
root@loxilb:/home/loxilb # wrk -t8 -c400 -d30s http://20.20.20.1:2020/
- where t: No. of threads, c: No. of connections. d: Duration of test
We also run other popular performance testing tools like netperf, iperf along with wrk for the above topology. A quick explanation of terminologies used :
RPS - requests per seconds. Given a fixed number of connections, this denotes how many requests/message per second can be supported
CPS - connections per second. This denotes how many new TCP connection setup/teardowns can be supported per second and hence one of the most important indicators of load-balancer performance
CRR - connect/request/response. This is same as CPS but netperf tool uses this term to refer to CPS as part of its test scenario
RR - request/response. This is another netperf test option. We used it to measure min and avg latency
The results are as follows :
Case 1. System Configuration - Intel(R) Core(TM) i7-4770HQ CPU @ 2.20GHz , 3-Core, 6GB RAM, Kernel 5.15.0-52-generic
| Tool | loopback | loxilb | ipvs |
|---|---|---|---|
| wrk(RPS) | 38040 | 44833 | 40012 |
| wrk(CPS) | n/a | 7020 | 6048 |
| netperf(CRR) | n/a | 11674 | 9901 |
| netperf(RR min) | 12.31 us | 15.2us | 19.75us |
| netperf(RR avg) | 61.27 us | 78.1us | 131us |
| iperf | 43.5Gbps | 41.2Gbps | 34.4Gbps |
Case 2. System Configuration - Intel(R) Xeon(R) Silver 4210R CPU @ 2.40GHz, 40-core, 124GB RAM, Kernel 5.15.0-52-generic
| Tool | loopback | loxilb | ipvs | haproxy |
|---|---|---|---|---|
| wrk(RPS) | 406953 | 421746 | 388021 | 217004 |
| wrk(CPS) | n/a | 45064 | 24400 | 22000 |
| netperf(CRR) | n/a | 375k | 174k | 21k |
| netperf(RR min) | n/a | 12 us | 15us | 27us |
| netperf(RR avg) | n/a | 15.78 us | 18.25us | 35.76us |
| iperf | 456Gbps | 402Gbps | 374Gbps | 91Gbps |
Conclusion/Notes -
- loxilb provides enhanced performance across the spectrum of tests. There is a noticeable gain in CPS
- loxilb's CPS is limited only by the fact that this is a single node scenario with shared resources
- "loopback" here refers to client and server running in the same host/pod. This is supposed to be the best case scenario but since there is only a single end-point for lo compared to 3 for LB testing , hence the RPS measurements are on the lower side.
- iperf is run with 100 threads ( iperf X.X.X.X -P 100 )
- haproxy version used - 2.0.29
- netperf test scripts can be found here
Watch the video
https://github.com/loxilb-io/loxilbdocs/assets/106566094/6cf85c4e-7cb4-4d23-b5f6-a7854e07cd7b